Data-Informed Decision Making
By Mary Lou Jay
Seaports have always used data – like the number of TEUs handled or passengers served – to measure their current success and to plan for the future. Now they have the potential to do even more. New methods of collecting information and the growth of computing power and cloud storage has made it possible for ports to capture, store and analyze data and become more efficient in their operations and processes.
Time-Saving Data Manipulation Tactics
Port Tampa Bay has been working with SME Solutions Group to incorporate business intelligence analytics (BI) into its processes. With their first project, the port was able to reduce the time it took to compile the monthly board report from more than 40 hours to about 20 minutes. Instead of staff members manually retrieving the information from several different systems, an automated system now brings all the data together and consolidates it into the necessary format for the board.
There are additional benefits to this approach to data handling. “The customers get value in finding new insights by bringing together data sets that used to be separate,” said Ron Katzman, SME’s director of strategy and operations. At Port Tampa Bay, financial data was kept in one system while real estate information resided in another. Being able to review both sets of data at the same time has enabled the port to identify some discrepancies and correct them.
“When people are manually doing things, there’s a lot of data integrity, data trust and data reliability that any organization struggles with,” added Chris Moyer, SME’s CEO. “When analytics and process are put into place, it allows IT to find those data discrepancies and clean them up.” With better data, ports can make more informed decisions.
The availability of real-time data also enabled the port’s staff to track the number of passengers using its cruise ship terminal. Instead of having to wait a month or more to hear about the million-passenger milestone, they were all able to see it and celebrate immediately.
Marketing and Preserving Port Lands
The data in the Port of South Louisiana’s Geographic Information Systems (GIS) is a powerful tool in marketing available properties along its 54-mile riverfront.
After reviewing maps and basic GIS information about the port’s available property on its website (http://portsl.com/gis/), companies can meet with port staff to take a deeper dive into the GIS information. They can access data about a site’s overall acreage (good and bad), the river depth at the location, neighboring industries and its proximity to rail and highway systems. Companies use the data to narrow down their choices before making actual site visits.
“We have a billion dollars’ worth of new investment committed to the port, based on information that they [companies]have found through the GIS,” said Paul Aucoin, the port’s executive director. “GIS allows us to make presentations, very precisely and very rapidly, about a potential site where they could locate.” The 17 new sites coming in plan on spending $24.5 billion on construction costs; that doesn’t include the long-term impact they’ll have on the local economy.
“When people are manually doing things, there’s a lot of data integrity, data trust and data reliability that any organization struggles with.”
—Chris Moyer, SME Solutions Group
Some GIS data is being used to protect valuable land around ports. The Duluth-Superior Metropolitan Interstate Council develops plans for multi-modal transportation systems in a region that includes the twin ports of Duluth, Minn., and Superior, Wis. The Duluth-Superior Port Land Use Plan, updated in 2016, will guide the development and redevelopment of the working waterfront areas along the harbor.
“It tries to use the land adjacent to the 27-foot navigation channel for development appropriate to a maritime use,” said Ron Chicka, the council’s executive director. “It’s trying to preserve the industrial land of the waterfront from encroachment of non-industrial uses.”
As they worked, planners drew upon the council’s GIS, which included the current zoning for each land parcel (drawn from city and county data) and information about the owners and any structures on the parcel. They then gathered input from a variety of stakeholders and also identified various local, state and federal policies and regulations that could impact development activities within or adjacent to specific parcels of land and sections of the waterway.
The future land use map that planners developed with the GIS presents planners’ recommendations for the harbor’s land uses: commercial, industrial, maritime, natural areas, public utilities, recreation and residential development.
Building a Construction Record
The complex building projects going on at many ports generate massive amounts of data. Construction collaboration software can help keep that data under control and readily accessible.
One example is PlanGrid, a field collaboration software developed by Autodesk. It can create an entire project data record set that includes anything from blueprints to building information modeling (BIM) data, project activity information and documents like specifications, RFIs, submittals and field reports. This information can be shared with all interested parties – port managers, designers, general contractors and subcontractors. That helps ensure that everyone stays in sync and can work efficiently to minimize mistakes, rework, and budget and schedule overruns, according to Ross Wagner, technical solutions executive at AutoDesk.
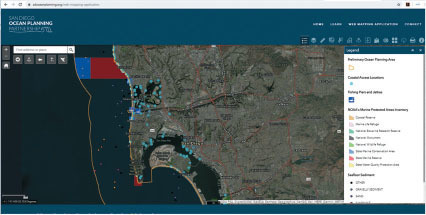
INTERACTIVE APP SHOWS THE OCEAN SPACE OFFSHORE IN SAN DIEGO COUNTY

The San Diego Ocean Planning Partnership, which includes the Port of San Diego, has developed an interactive web mapping application (www.sdoceanplanning.org/web-mapping-application) of the dynamic ocean space offshore of San Diego County.
The map brings together data from many sources – commerce, navigation, fisheries, recreation and environmental stewardship. Map users can choose which data overlays they want to see. The goal is to help people and organizations better understand the current use of ocean space, the challenges surrounding current and future uses and possible conflicts between the various users.
Wagner said that PlanGrid is currently being employed by the project team that’s building facilities at a West Coast port. They’re using it for document/data control and field collaboration.
“Ensuring the entire project team, from the office to the field, is referencing the most current information is critical for delivering successful construction projects,” he added. “On average, PlanGrid users save seven hours per week by having the latest information at their fingertips.”
A Data-Driven Future
As ports become more comfortable in capturing and analyzing data, they’ll find more opportunities to increase their efficiency. For example, with sensors placed on port equipment sending information on their current status, maintenance departments could use predictive analytics to determine when a crane or forklift needs servicing or when a part is about to fail. Preventive action could reduce downtime.
“We have a billion dollars’ worth of new investment committed to the port, based on information that they [companies]have found through the GIS [Geographic Information System].”
—Paul Aucoin, Port of South Louisiana
Drones could help improve security by sending back data about physical breaches in fences or barriers or by helping security personnel track trends in stock movement and personnel.
Artificial intelligence software could analyze collected data, detect flooding patterns during a hurricane and provide insights that could drive new construction projects or improve flood mitigation efforts.
Ports will be most successful when data analytics become embedded throughout their culture. That requires leaders who proactively embrace the concept and staff members trained in data literacy, Katzman said. It also requires resiliency; if managers who have championed data analytics leave, their replacements also need to understand the importance of data to the port’s operations.
Ports that lead the way in using data will create the same kind of competitive advantage that Walmart, eBay and other businesses have enjoyed. “There were others that tried to do the same thing as those companies and weren’t as successful. At least partially, that was because they really embraced data to become market leaders,” Katzman added.
“While the competition in ports is slower moving, I think the same evolution is going to happen in this industry.”

VESSEL PILOTS NOW HAVE ACCESS TO REAL-TIME WEATHER WARNINGS
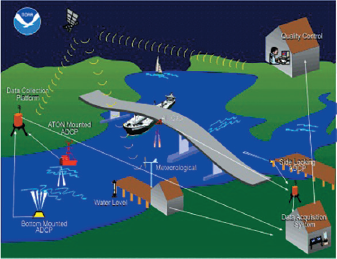
National Oceanic and Atmospheric Administration (NOAA) has developed a way to provide vessel pilots with real-time data about environmental conditions at several ports.
PORTS® (Physical Oceanographic Real-Time System) uses an integrated system of oceanographic and meteorological sensors to collect data on water levels, currents, waves, bridge clearances, winds, air and water temperatures and visibility. Mariners can access this information, updated every six minutes, via a web page (https://tidesandcurrents.noaa.gov/ports or https://mobile.tidesandcurrents.noaa.gov/) or toll-free phone numbers.
The U.S. Coast Guard Marine Safety Unit in Duluth, Minn., is working with the USCG Navigation Center (NAVCEN) and local ship pilots to make this data available to ships entering Superior Harbor through Automatic Identification Systems (AIS). Mariners could simply select a location on their electronic chart to see the data for that area, regardless of internet speed and capabilities, according to Lt. Abbie Lyons, CG MSU Duluth.
Access to environmental data will enhance mariners’ situational awareness, help them better understand the area’s environment and enable them to make more educated decisions about navigation, Lyons added.
About one-third of the 175 U.S. seaports have invested in the PORTS program. They work with NOAA to determine the number of sensors and the type of data that they capture. (The largest PORTS’ installation has more than 100 individual sensors; the smallest has a single water level sensor and several meteorological sensors.)
With ports now handling bigger vessels and more traffic, NOAA hopes that the PORTS program will help improve the safety and efficiency of the U.S. marine transportation system.